.NET Charts (Pleasing clients by giving them a graph to look at)
Irrespective of if your working on some kind of company extranet or the admin side of a public facing site, one thing that will make you're clients go ooooooo and love your work is the inclusion of a funky looking chart. It may not serve any amazing purpose, but as there looking through all the boring text area's and buttons that actually make up the functionality of the site, the inclusion of nice looking chart is going to make them go "oooo that's nice" and like you even more. For those of us working in .NET, thanks' to an update from Microsoft at the end of 2008 it's also something that've very quick an easy to do. Better yet the update was free so the only cost is the time you take to implement it.
First off if you want to use the chart's and you haven't downloaded them then that's what you need to do. The chart's shipped after .NET 3.5 so there a separate install, .NET 4 however has them included by default.
Using the Chart Control
Like I said adding a chart to a page is a quick and easy thing to do. Once you have the Visual Studio add on installed you can also drag and drop everything into place. However I'm going to go into a bit more detail.
To start your going to need a data source. In this example I'm using a SQL Data Source object for ease of use, in a production environment I heavily recommend against using them as there going to make your code a completely unmanageable mess, instead I would use something like a Entity Data Source. My chart is going to be showing a graph of mobile phone handset popularity so my SQL is simply just returning a table of phone names and how many people use them.
Code so far:
1<asp:SqlDataSource ID="ChartDB" runat="server" ConnectionString="<%$ ConnectionStrings:ConnectionString %>" SelectCommand="SELECT [Name], [People] FROM [PhonePopularity]">2</asp:SqlDataSource>
Next we need to add a chart, the easiest way to do this is to just drag a chart object onto the page from the toolbox, however if you do want to type it yourself it's not particularly complex.
First you will need to register the assembly on the page..
1 <%@ Register assembly="System.Web.DataVisualization, Version=3.5.0.0, Culture=neutral, PublicKeyToken=31bf3856ad364e35" namespace="System.Web.UI.DataVisualization.Charting" tagprefix="asp" %>
And then add the chart like so...
1<asp:Chart ID="Chart1" runat="server" DataSourceID="ChartDB" Height="400px" Width="400px">2 </asp:Chart>
Now we're ready to start customizing what type of chart we're going to have and what data it should show from our data source.
To actually show a chart there's two bits of information you have to describe, area's and series'. The first area's is used to define an area for a chart to appear, one interesting thing about the chart control is you aren't limited to just one area. In fact in this example I'm going to have to chart's one showing a pie chart of phone popularity that will quickly show what kind of share each phone has, and then a second bar chart making it more clear the actual numbers people have of each phone. Area's also let you set properties on what the chart is actually going to look like as well. In this instance I'm going to set for both charts to be 3D.
The second bit of information is the Series. This is where you're actually specifying what data is going to be shown in which area and what kind of chart it is (e.g. Pie, Column, Donut etc). My completed code then looks like this...
1<asp:Chart ID="Chart1" runat="server" DataSourceID="ChartDB" Height="400px" Width="400px">23<series>45<asp:Series ChartArea="ChartArea1" ChartType="Pie" Name="Series1" XValueMember="Name" YValueMembers="People">6</asp:Series>7<asp:Series ChartArea="ChartArea2" Name="Series2" XValueMember="Name" YValueMembers="People">8</asp:Series>910</series>11<chartareas>1213<asp:ChartArea AlignmentOrientation="Horizontal" Name="ChartArea1">1415<Area3DStyle Enable3D="True" />1617</asp:ChartArea>18<asp:ChartArea Name="ChartArea2">1920<area3dstyle enable3d="True" />2122</asp:ChartArea>2324</chartareas>2526</asp:Chart>
Depending on your data this should give you something like this...
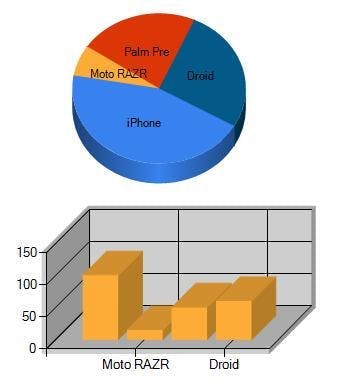
This is just a simple example of what you can do, but if you download the Chart Samples Project and have a look through there is no end to the possibilities with everything from different styles of charts to adding ajax functionality even with the ability to click of different parts of the carts to trigger events.