Debugging VueJS + TypeScript with VS Code
I recently asked a developer working with VueJS how they do debugging and they told me console.log. Not wanting to go back to the dark ages of development I went and found the solution myself.
The VueJS website has a guide on how to do debugging with VS Code https://vuejs.org/v2/cookbook/debugging-in-vscode.html however the instructions they give don't work with TypeScript. Interestingly it does get you far enough to set breakpoints within either Chrome or Edge, but I don't really count that as a solution. The idea of debugging is you step through your code and see everything that is happening, not step through a copy of your code and then go and find the corresponding file in your code editor.
After a bit of digging I managed to get it to work, so here's my solution.
Prerequisites
This part is essentially as per the VueJS guide.
Make sure you have VS Code installed and install the Debugger for Chrome. Don't worry if you use Edge, the same extension will work.
Create your project with the vue-cli, following the instructions in the Vue CLI Guide. When you do this make sure you pick Typescript.
Displaying Source Code in the Browser
This isn't what we're after but it's still a step we must do.
Create a file called vue.config.js in the root of your solution and paste the following into it. This creates the mapping for the debugger to map compressed files back to the original.
1module.exports = {2 configureWebpack: {3 devtool: 'source-map'4 }5}
Configure debugging from VS Code
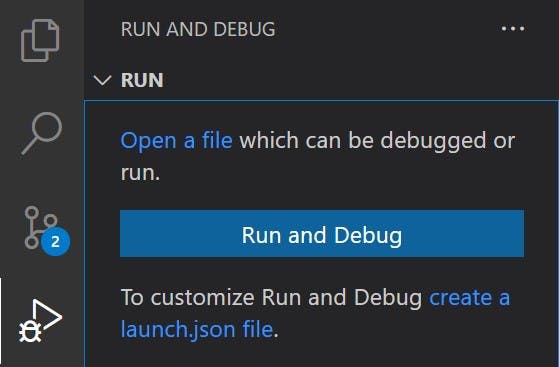
In VS Code select the Run and Debug button on the left and click the Run and Debug button. If you don't see this button it probably means that you already have a launch.json file defined. Instead a cog will appear at the top to edit the existing settings.
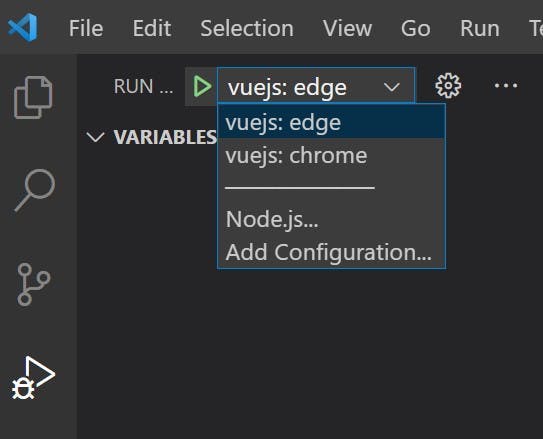
From the options choose either Chrome or Edge.
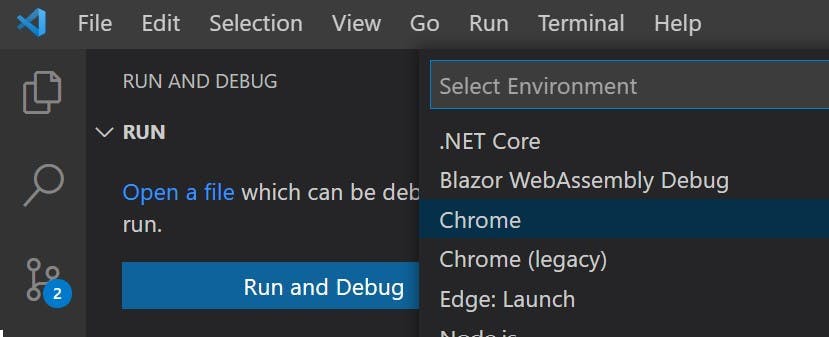
This will create a launch.json file with some defaults filled out. Replace the contents of the file with the below (this is the part which differs from the instructions on VueJS's site).
I have included 2 configurations, one for debugging with Chrome and the other for Edge. They are both essentially the same and just launch a different browser.
1{2 // Use IntelliSense to learn about possible attributes.3 // Hover to view descriptions of existing attributes.4 // For more information, visit: https://go.microsoft.com/fwlink/?linkid=8303875 "version": "0.2.0",6 "configurations": [7 {8 "type": "pwa-msedge",9 "request": "launch",10 "name": "vuejs: edge",11 "url": "http://localhost:8080",12 "webRoot": "${workspaceFolder}",13 "breakOnLoad": true,14 "sourceMapPathOverrides": {15 "webpack:///./*": "${webRoot}/*"16 },17 "skipFiles": [18 "${workspaceFolder}/node_modules/**/*"19 ]20 },21 {22 "type": "chrome",23 "request": "launch",24 "name": "vuejs: chrome",25 "url": "http://localhost:8080",26 "webRoot": "${workspaceFolder}",27 "breakOnLoad": true,28 "sourceMapPathOverrides": {29 "webpack:///./*": "${webRoot}/*"30 },31 "skipFiles": [32 "${workspaceFolder}/node_modules/**/*"33 ]34 }35 ]36}
Debug from VS Code
To start your debugging you still need to start the application from a terminal with npm run serve. The debugging experience is more like Visual Studios attaching to a process rather than running application by clicking start.
Once your application is running, to attach the debugger either press either F5 or go to the run and debug tab, make sure your browser of choice is selected and click the green play button. Your browser of choice will now open and VS Code should be attached and any break points you create will be hit.