Debugging NextJS 14 with VSCode
Using debugging tools when you're developing is something that in my mind is absolutely essential, and I'm shocked whenever I see people response.writing out values to work out what's going wrong in there application. In the past I've written about debugging VueJS in VS Code and the setup for NextJs is somewhat similar.
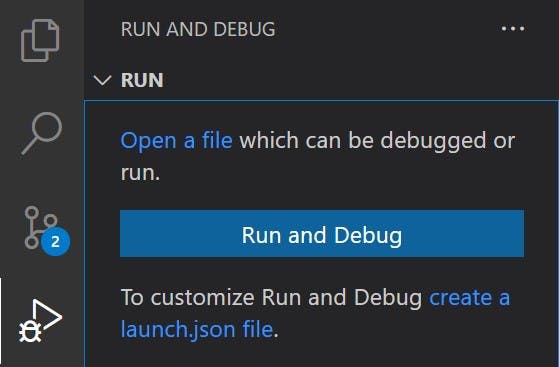
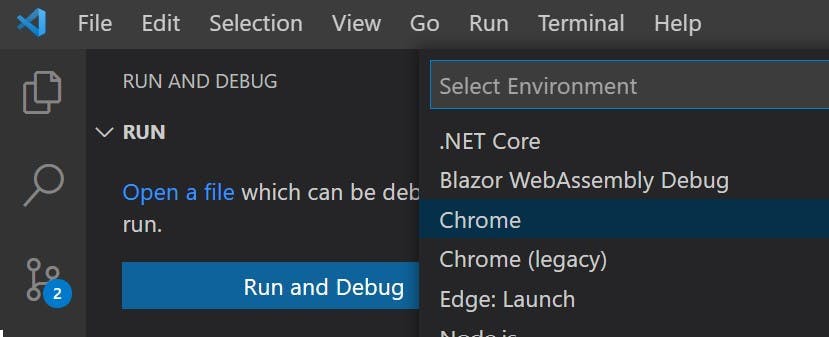
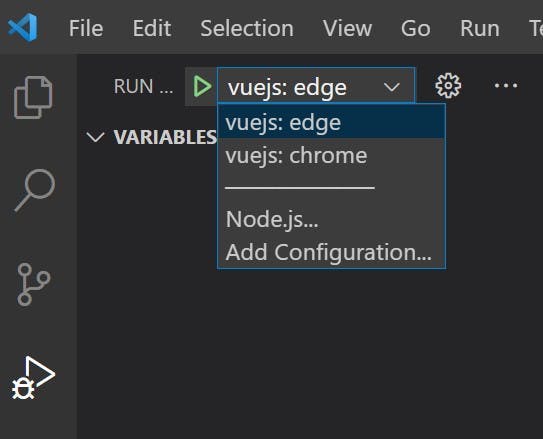
With VS Code you have launch.json file which instructs how VS Code should start an application in debug mode when you hit F5.
Launch.json for NextJs 14 using app router
The launch.json file for NextJs 14 is very simple and consists of the following:
1{2 "version": "0.2.0",3 "configurations": [4 {5 "name": "Next.js: debug full stack",6 "type": "node-terminal",7 "request": "launch",8 "command": "npm run dev",9 "serverReadyAction": {10 "pattern": "- Local:.+(https?://.+)",11 "uriFormat": "%s",12 "action": "debugWithChrome"13 }14 }15 ]16}17
Launch.json for NextJs 13 using page router
The launch.json file for NextJs13 is slightly different. This one also includes an attach option which will attach to the running process if you've already manually started NextJs from the command line.
1{2 "version": "0.2.0",3 "configurations": [4 {5 "name": "Next.js: debug full stack",6 "type": "node-terminal",7 "request": "launch",8 "command": "npm run dev",9 "console": "integratedTerminal",10 "serverReadyAction": {11 "pattern": "started server on .+, url: (https?://.+)",12 "uriFormat": "%s",13 "action": "debugWithChrome"14 }15 }16 ]17}18
This file will also work for NextJs 14, however I found that any component marked as "use client" doesn't hit any of the breakpoints in client side code. It also doesn't trigger chrome to open when the application starts.