Debugging Sitecore 9 Analytics Issues
With Sitecore 9 the way analytics is recorded and processed changed. Rather than everything being done by the IIS application, the architecture changed to include:
- A second IIS application called xconnect
- A windows services called Sitecore XConnect Search Indexer
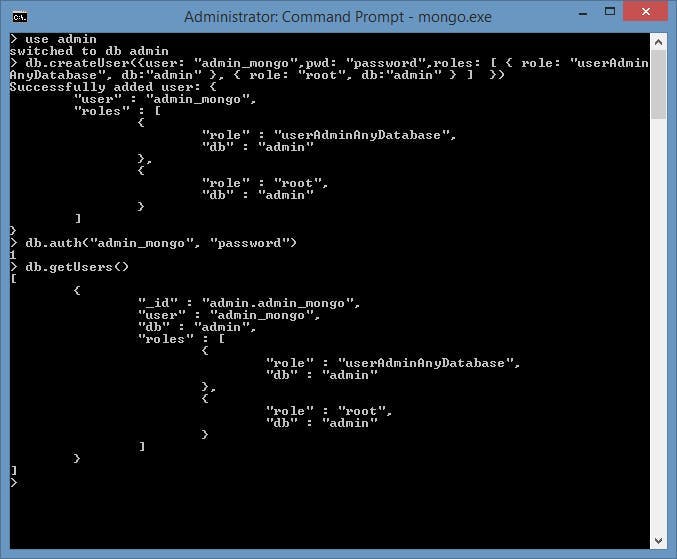
As well as this Mongo was replaced by:
- SQL Server databases
- A SOLR XDB Core
Sitecore 9 also introduced data being secure in transit as well as at rest which means all traffic is encrypted using certificates.
While all these peices can be considered good, it does also create more points of failure that becomes harder to debug. So after spending a decent amount of time debugging why no analytic reports were loading and then why no data was appearing in the reports, I've made a checklist to go through.
Debugging Sitecore Analytics Checklist
1. XConnect Connection String
The main Sitecore application has connection strings for where it will find the XConnect service. They will look like this:
1 <add name="xconnect.collection" connectionString="https://mysite.xconnect" />2 <add name="xconnect.collection.certificate" connectionString="StoreName=My;StoreLocation=LocalMachine;FindType=FindByThumbprint;FindValue=EF7F38B623E6664359110F2C6EB6DA00D567950F" />
One gives the path to the XConnect service and the other gives the path to find the certificate.
Firstly check that the XConnect path is correct and that you can access it and secondly check that the thumbprint corresponds with a certificate in the certificate store.
You can see what certificates are on your machine using this PowerShell script:
1Get-ChildItem -Path "cert:\LocalMachine\Root" | Format-Table Subject, FriendlyName, Thumbprint2Get-ChildItem -Path "cert:\LocalMachine\My" | Format-Table Subject, FriendlyName, Thumbprint3Get-ChildItem -Path "cert:\CurrentUser\My" | Format-Table Subject, FriendlyName, Thumbprint
2. Check certificate expiry date
Having a certificate is a good start, but it could still have expired.
Find the certificate in the certificate store by hitting start > manage computer certificates and find it in one of the folders.
Check the expiration date. If it's in the past then it's not going to work. This is common because the installation script for Sitecore 9 will set the expiration date to a year after install by default.
If it has expired you will need a new cert, you can create this by using the same script that you used to install sitcore origionally (Just the certificate bit).
1#Switch to correct vesion of SIF2Remove-Module -Name SitecoreInstallFramework3Import-Module -Name SitecoreInstallFramework -RequiredVersion 1.2.145#define parameters6$prefix = "SitePrefix"7$PSScriptRoot = "C:\resourcefiles9.0"8$XConnectCollectionService = "$prefix.xconnect"9$sitecoreSiteName = "$prefix.sc"1011#install client certificate for xconnect12$certParams = @{13 Path = "$PSScriptRoot\xconnect-createcert.json"14 CertificateName = "$prefix.xconnect_client"15 RootCertFileName = "SIF121Root"16}
3. Check security permissons on the certificate
If you have a certificate and it's still valid then it could be that the app pool the site is running in doesn't have access to read the certificate.
To check this:
- Right click the certificate
- All Tasks
- Manage Private Keys
- Check that the app pool user for your site is listed in the list of users and that it has read permission. If it's not there add it using the name
IIS APPPOOL\app pool name
4. Check License Files
Partner licenses only last for a year so if your using one of those it may have expired.
We're all used to checking the license file in the Sitecore application but XConnect has a license too.
These will be in:
sitename.xconnect\App_data\
sitename.xconnect\App_data\jobs\continuous\IndexWorker\App_data
sitename.xconnect\App_data\jobs\continuous\AutomationEngine\App_Data
Only the first will be used when your viewing the site, but it's worth knowing about the others to, incase you ever run a job manually.
5. Check manual rebuild of indexes
You can trigger a manual rebuild of the xDB index by following these instructions:
https://doc.sitecore.com/developers/90/sitecore-experience-platform/en/rebuild-the-xdb-index-in-solr.html
Remember in point 4 that it has it's own license file. It also has it's own connection strings.
6. Check XConnect site works in a browser
If you open XConnect in a browser you should recieve no certificate errors and a timestamp saying how long XConnect had been running for.
7. Check certificates are in the right store
This stack overflow post was a big help for me (https://stackoverflow.com/questions/26247462/http-error-403-16-client-certificate-trust-issue ). I was at the point where everything seemed right, but moving the certificates as shown here got it to the point of the analytics reports loading.
Windows 2012 introduced stricter certificate store validations. According to KB 2795828: Lync Server 2013 Front-End service cannot start in Windows Server 2012, the Trusted Root Certification Authorities (i.e. Root) store can only have certificates that are self-signed. If that store contains non-self-signed certificates, client certificate authentication under IIS returns with a 403.16 error code.
To solve the problem, you have to remove all non-self-signed certificates from the root store. This PowerShell command will identify non-self-signed certificates:
1Get-Childitem cert:\LocalMachine\root -Recurse |2 Where-Object {$_.Issuer -ne $_.Subject}
In my situation, we moved these non-self-signed certificates into the Intermediate Certification Authorities (i.e. CA) store:
1Get-Childitem cert:\LocalMachine\root -Recurse |2 Where-Object {$_.Issuer -ne $_.Subject} |3 Move-Item -Destination Cert:\LocalMachine\CA
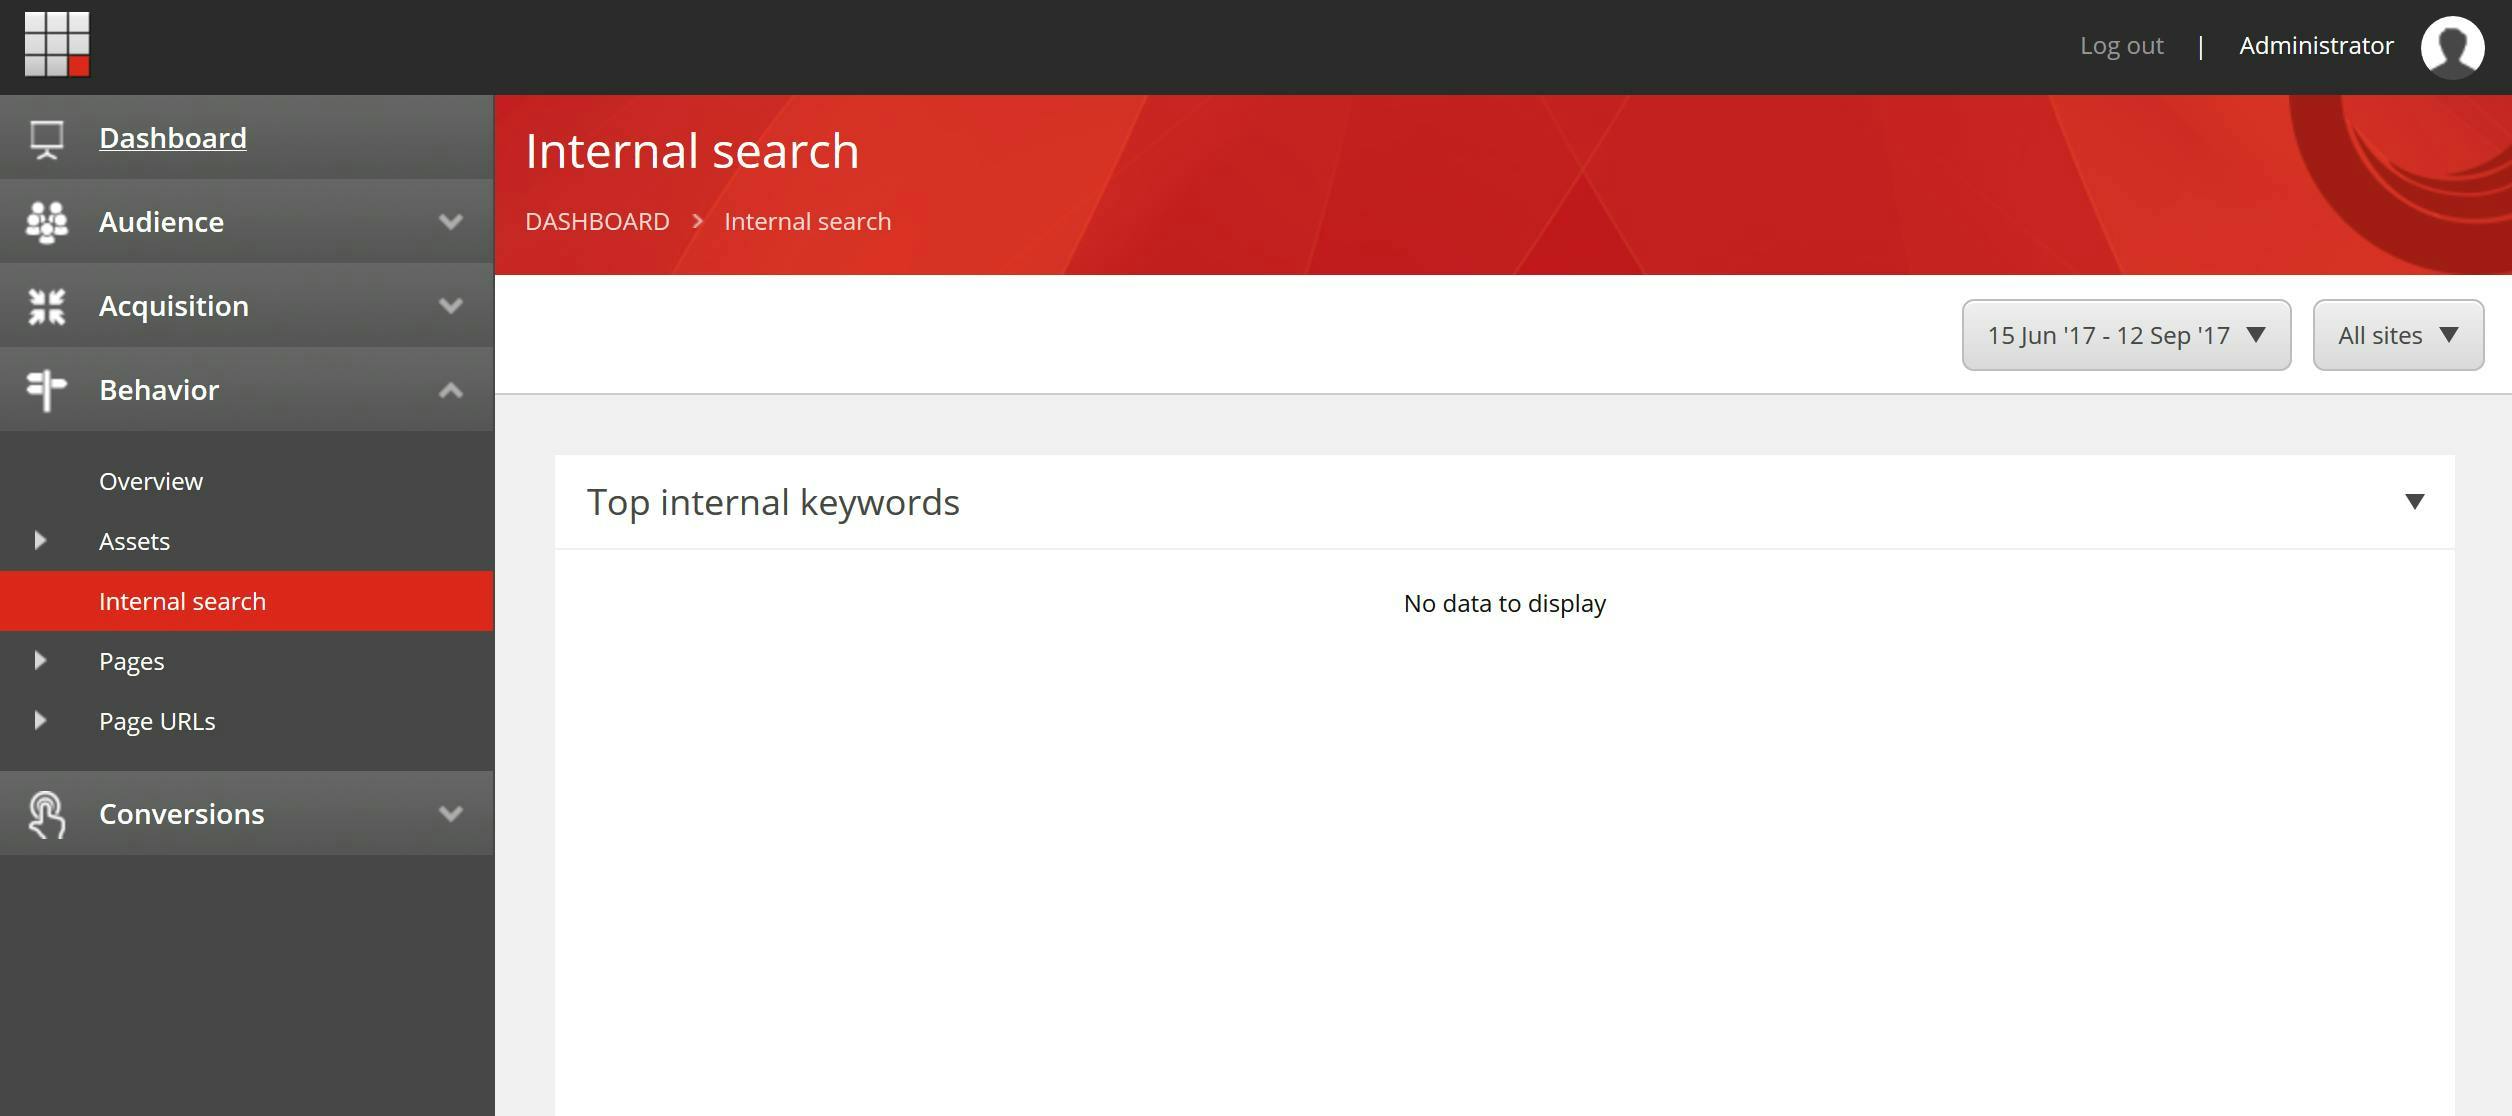
Checklist for data not going into Analytics
If you've got to the point of the analytics reports working, but not showing any data, this is my checklist for making sure data goes in. In my case I was trying to log site searches as per my article from a few years ago https://himynameistim.com/2017/09/13/populating-the-internal-search-report-in-sitecore/ there wern't any errors, but no data ever showed.
1. Enable Analytics Debugging
In Sitecore.Analytics.Tracking.config there is a setting to set the analytics logging level to debug. You will also need to set the log level on log4net root in Sitecore.config to debug.
2. Disable Robot Detection
In my case Sitecore thought I was a robot. Changing these settings will disable that:
1<setting name="Analytics.AutoDetectBots" set:value="false" />2<setting name="Analytics.Robots.IgnoreRobots" set:value="false" />
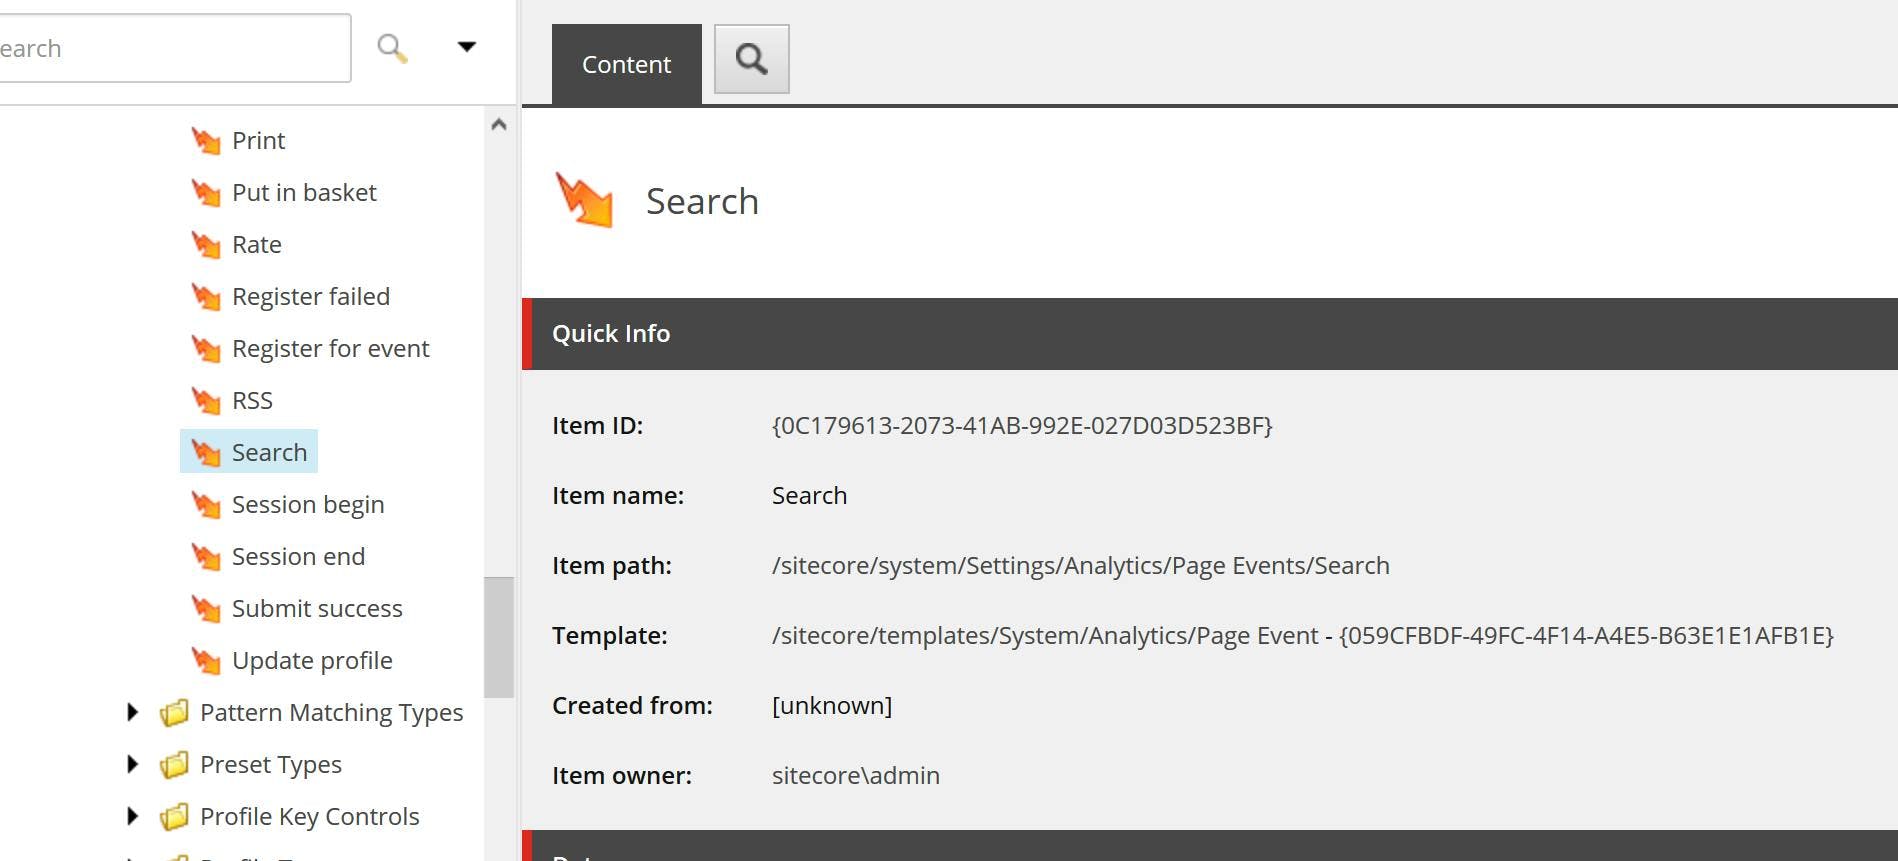
3. Test analytics is tracking something
One of the hardest parts about analytics is it's not instant. The initial tracking only goes into the DB at the end of the users session and that's only for collection. It won't appear in the reports until processing has happened. So to speed this up:
Create a page called kill.aspx as follows. This will end the users session and trigger the data to be fed into the DB.
1<%@ Page language="c#" %>23<!DOCTYPE html>4<html>5 <head>67 </head>8 <body>910<div>Session Abandoned</div>11<% Session.Abandon(); %>1213 </body>14</html>
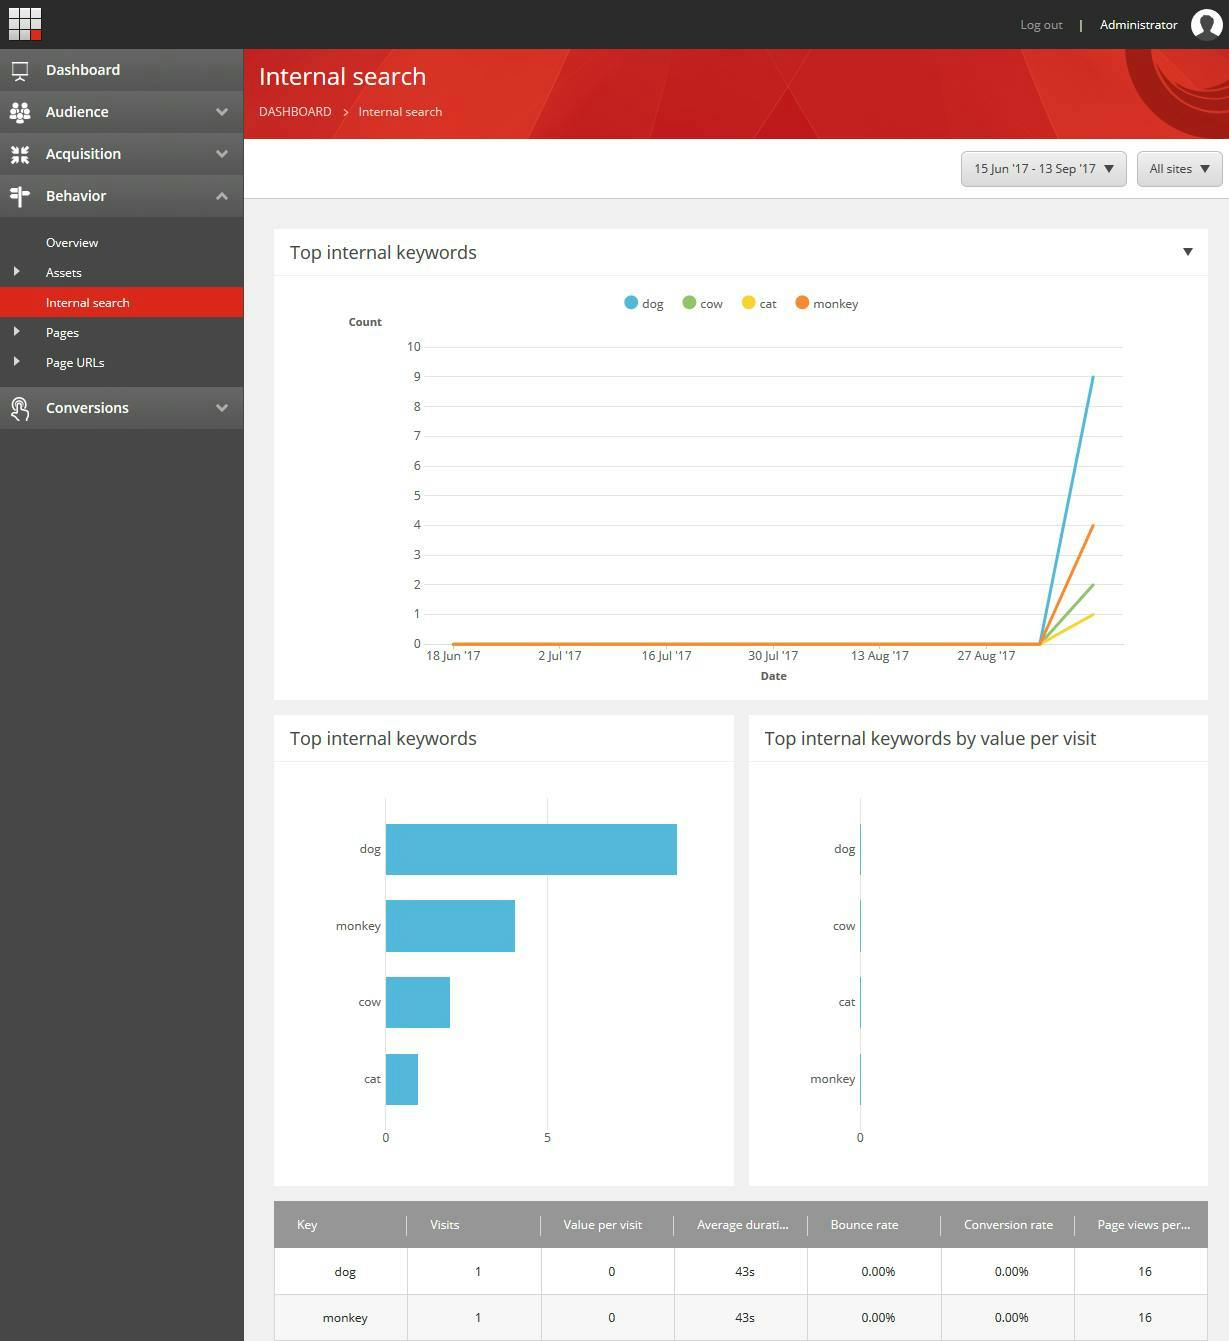
Next do something on the site that will cause some tracking to get added to the DB. In my case it was the search. Then go to kill.aspx to force session abondon.
Check the logs. You should see something like this...
125016 11:19:13 DEBUG [Analytics]: The CommitSession pipeline, ProcessSubscriptions is skipped - there is no subscriptions for location id: 4ebd0208-8328-5d69-8c44-ec50939c0967
Check the DB an entry should have gone into a shard db for [xdb_collection].[Interactions] table
To speed up processing, restart the main sitecore application.