Blog
Running multiple projects from Visual Studio

Running multiple projects from Visual Studio

We're probably all familiar with the debugging experience in Visual Studio. Press F5 or hit the green play button and your application will run in debug mode. If you have multiple projects in you solution which can run (i.e. they're not a class library) then the one with a bold title in solution explorer will run.

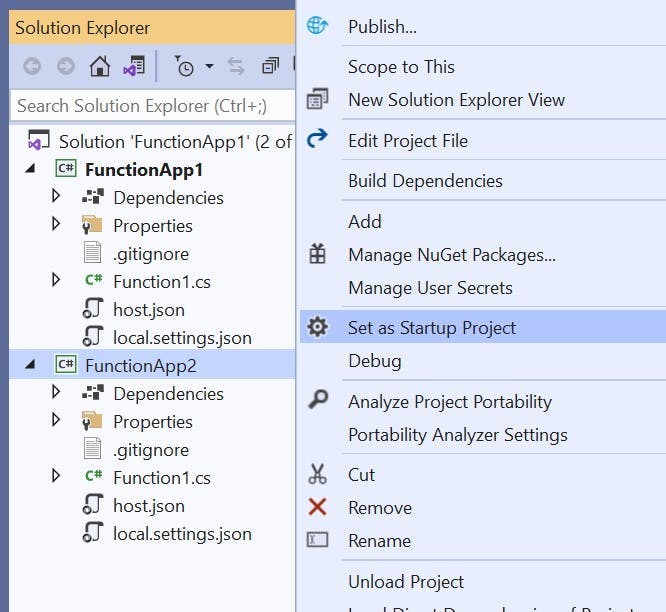
To change which project starts by default right click the project and choose Set as Startup Project.

Selecting start up project in Visual Studio

You can also use the drop down next to the play button to switch which project will run when you start debugging.

Selecting project to run in Visual Studio

Running multiple project at the same time

However switching between projects might not be what your after. You may need multiple projects running that interact with each other. e.g. You could have an API written as an Azure Function and a Website which uses the API. The simple option is to just open to copies of Visual Studio and run one in each, but there is a better way.

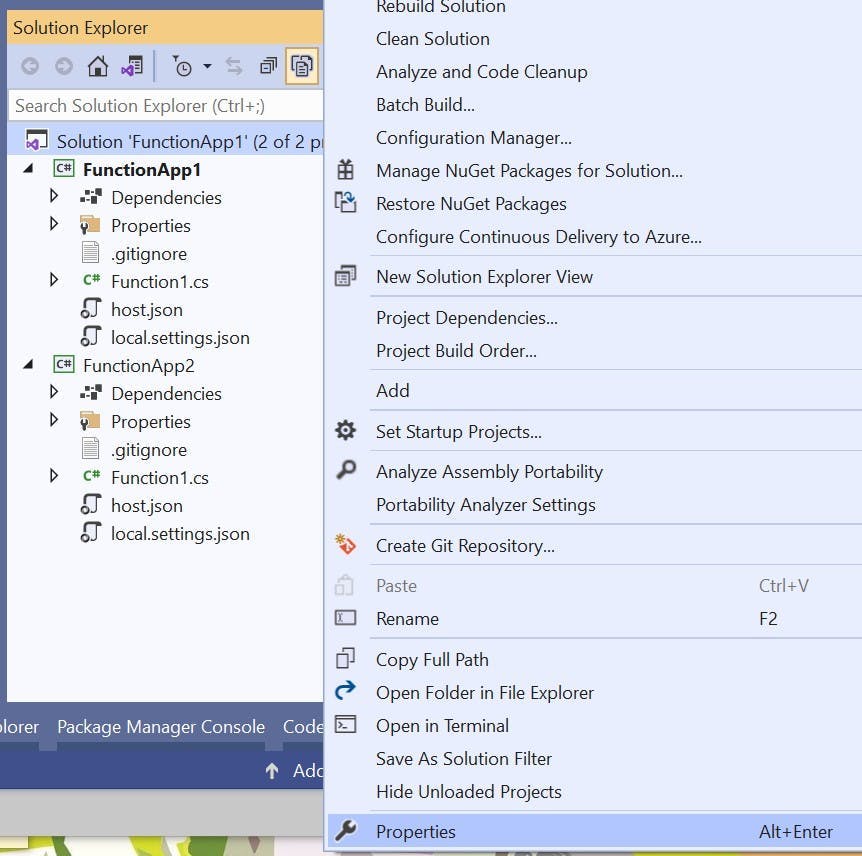
Right click your solution in Solution Explorer and click properties.

Selecting properties for solution in Visual Studio

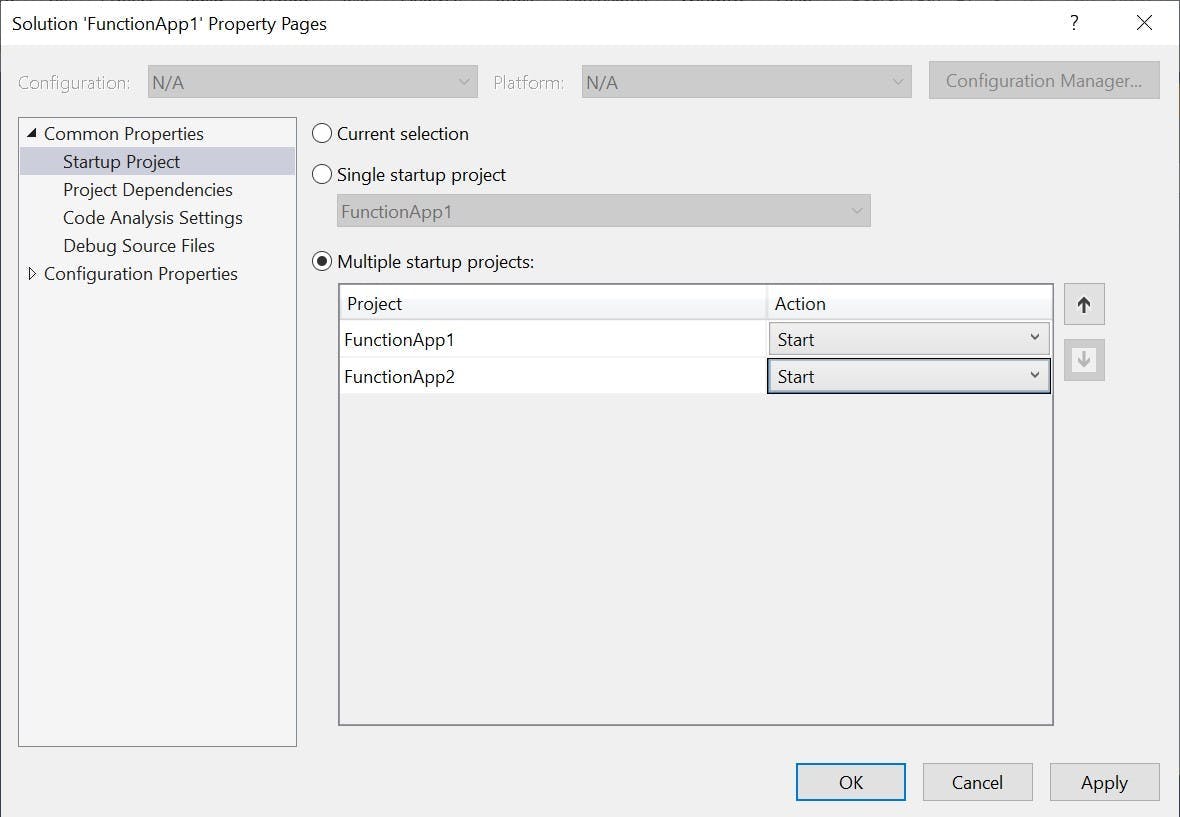
Make sure you have Startup project selected on the left. On the right change the radio to Multiple startup projects and in the grid use the drop down to change the action to either Start or Start without debugging on the projects you want to run.

Visual Studio selecting multiple startup projects

The drop down next the play button will now show that multiple startup projects have been selected.

Visual Studio multiple startup projects selected

Now when you start to debug all the projects you have set to start will all debug together for one seamless debugging experience. Just make sure they're not all running on the same port number.

Deploying a SQL DB with Azure Pipelines

Deploying a SQL DB with Azure Pipelines

Normally when I work with SQL Azure I handle DB schema changes with Entity Framework migrations. However if you using Azure Functions rather than Web Jobs it seems there's a number of issues with this and I could not find a decent guide which resulted in a working solution.

Migrations isn't the only way to release a DB change though. SQL Server Database projects have existed for a long time and are a perfectly good way of automating a DB change. My preference to use EF Migrations really comes from a place of not wanting to have an EF model and a separate table scheme when they're essentially a duplicate of each other.

Trying to find out how to deploy this through Azure Devops Pipelines however was far harder than I expected (my expectation was about 5 mins). A lot of guides weren't very good and virtually all of them start with Click new pipeline, then select Use the classic editor. WAIT Classic Editor on an article written 3 months ago!?!?! Excuse me while I search for a solution slightly more up to date.

Creating a dacpac file

High level the solution solution is to have a SQL Server Database project, use an Azure Pipeline to compile that to a dacpac file. Then use a release pipeline to deploy that to the SQL Azure DB.

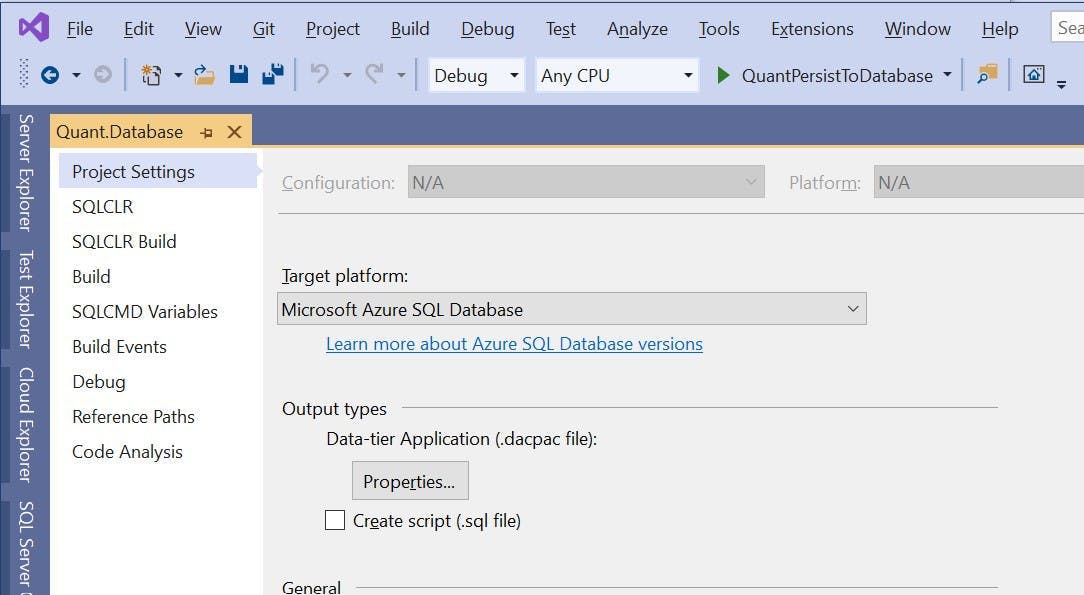
I'm not going to go into any details about how you create a SQL Server Database project, its relatively straightforward, but the one thing to be aware of is the project needs to have a target platform of Microsoft Azure SQL Database otherwise you'll get a compatibility error when you try to deploy.

Building a SQL Server Database project in Azure Devops

To build a dacpac file create a new pipeline in Azure Devops (the yaml kind), select your repo and get yourself a blank configuration file. Also at this point make sure your code is actually in the repo!

The configuration I used looks like this; I've included notes in the code to explain what's going on.

1# The branch you want to trigger a build
2trigger:
3- master
4
5pool:
6 vmImage: "windows-latest"
7
8variables:
9 configuration: release
10 platform: "any cpu"
11 solutionPath: # Add the path to your Visual Studio solution file here
12
13steps:
14 # Doing a Visual Studio build of your solution will trigger the dacpac file to be created
15 # if you have more projects in your solution (which you probably will) you may get an error here
16 # as we haven't restored any nuget packages etc. For just a SQL DB project, this should work
17 - task: VSBuild@1
18 displayName: Build solution
19 inputs:
20 solution: $(solutionPath)
21 platform: $(platform)
22 configuration: $(configuration)
23 clean: true
24
25 # When the dacpac is built it will be in the projects bin/configuation folder
26 # to get into an artifact (probably with some other things you want to publish like an Azure function)
27 # we need to move it somewhere else. This will move it to a folder called drop
28 - task: CopyFiles@2
29 displayName: Copy DACPAC
30 inputs:
31 SourceFolder: "$(Build.SourcesDirectory)/MyProject.Database/bin/$(configuration)"
32 Contents: "*.dacpac"
33 TargetFolder: "$(Build.ArtifactStagingDirectory)/drop"
34
35 # Published the contents of the drop folder into an artifact
36 - task: PublishBuildArtifacts@1
37 displayName: "Publish artifact"
38 inputs:
39 PathtoPublish: "$(Build.ArtifactStagingDirectory)/drop"
40 ArtifactName: # Artifact name goes here
41 publishLocation: container

Releasing to SQL Azure

Once the pipeline has run you should have an artifact coming out of it that contains the dacpac file.

To deploy the dacpac to SQL Azure you need to create a release pipeline. You can do this within the build pipeline, but personally I think builds and releases are different things and should therefore be kept separate. Particularly as releases should be promoted through environments.

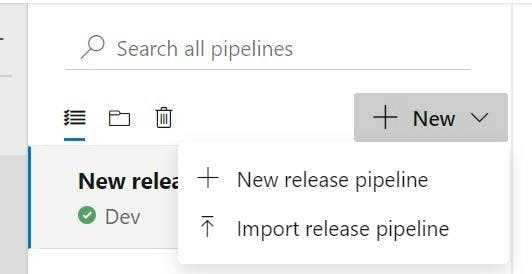
Go to the releases section in Azure Devops and click New and then New release pipeline.

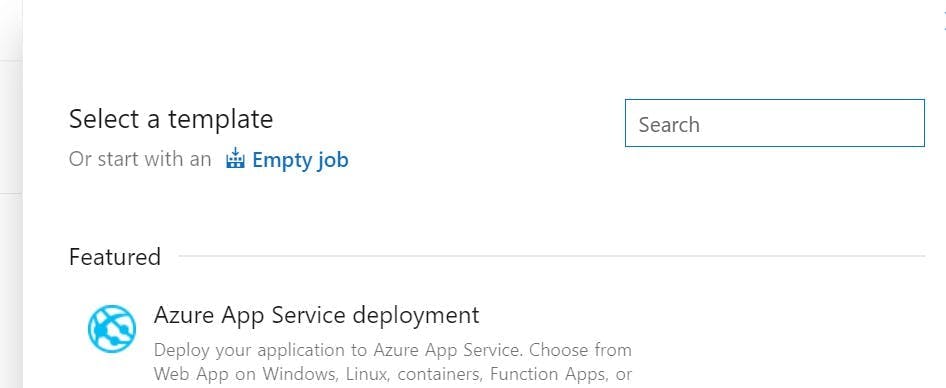
There is no template for this kind of release, so choose Empty job on the next screen that appears.

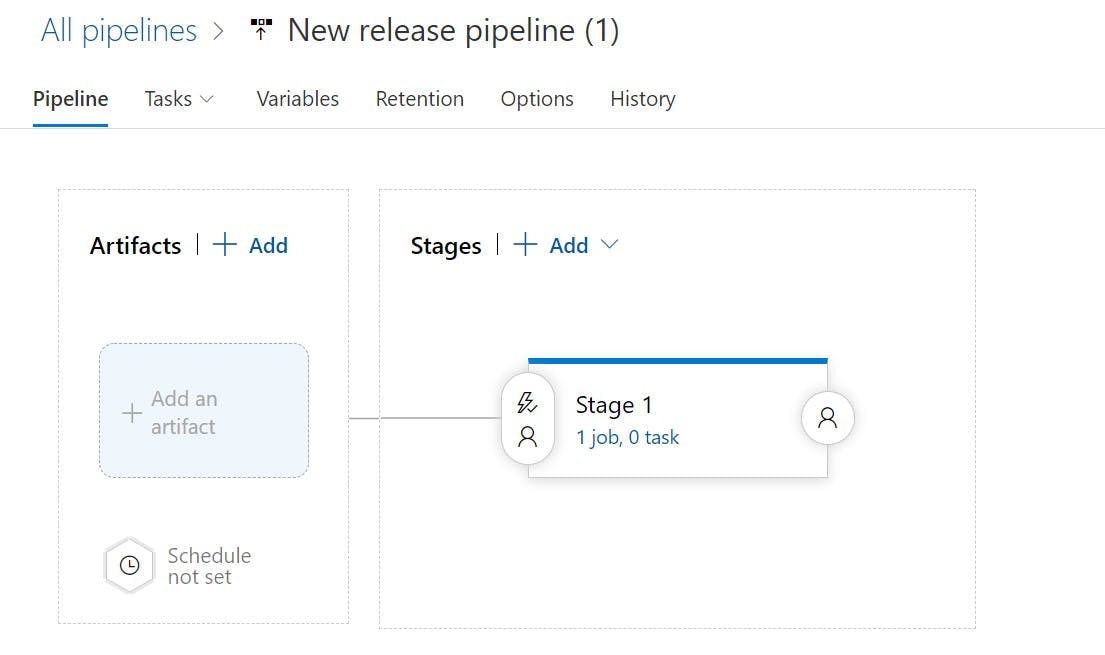
On the left you will be able to select the artifact getting built from your pipeline.

Then from the Tasks drop down select Stage 1. Stages can represent the different environments your build will be deployed to, so you may want to rename this something like Dev or Production.

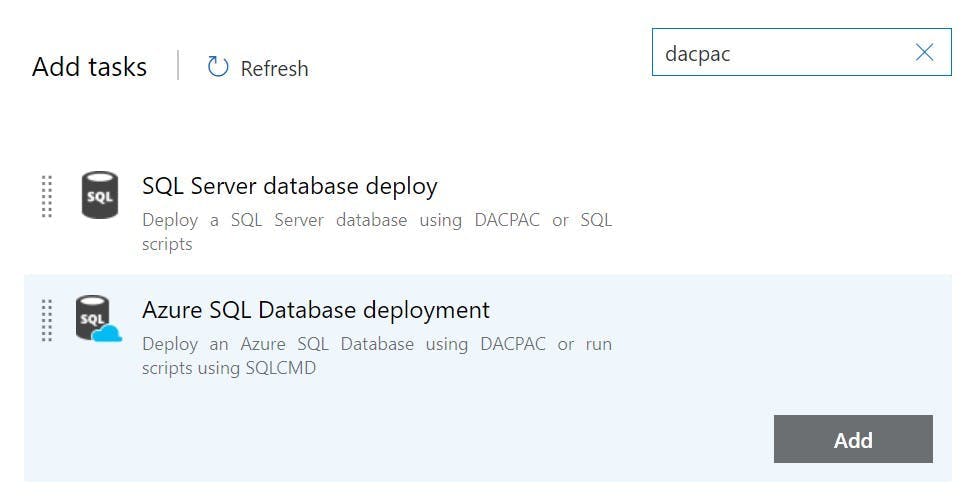
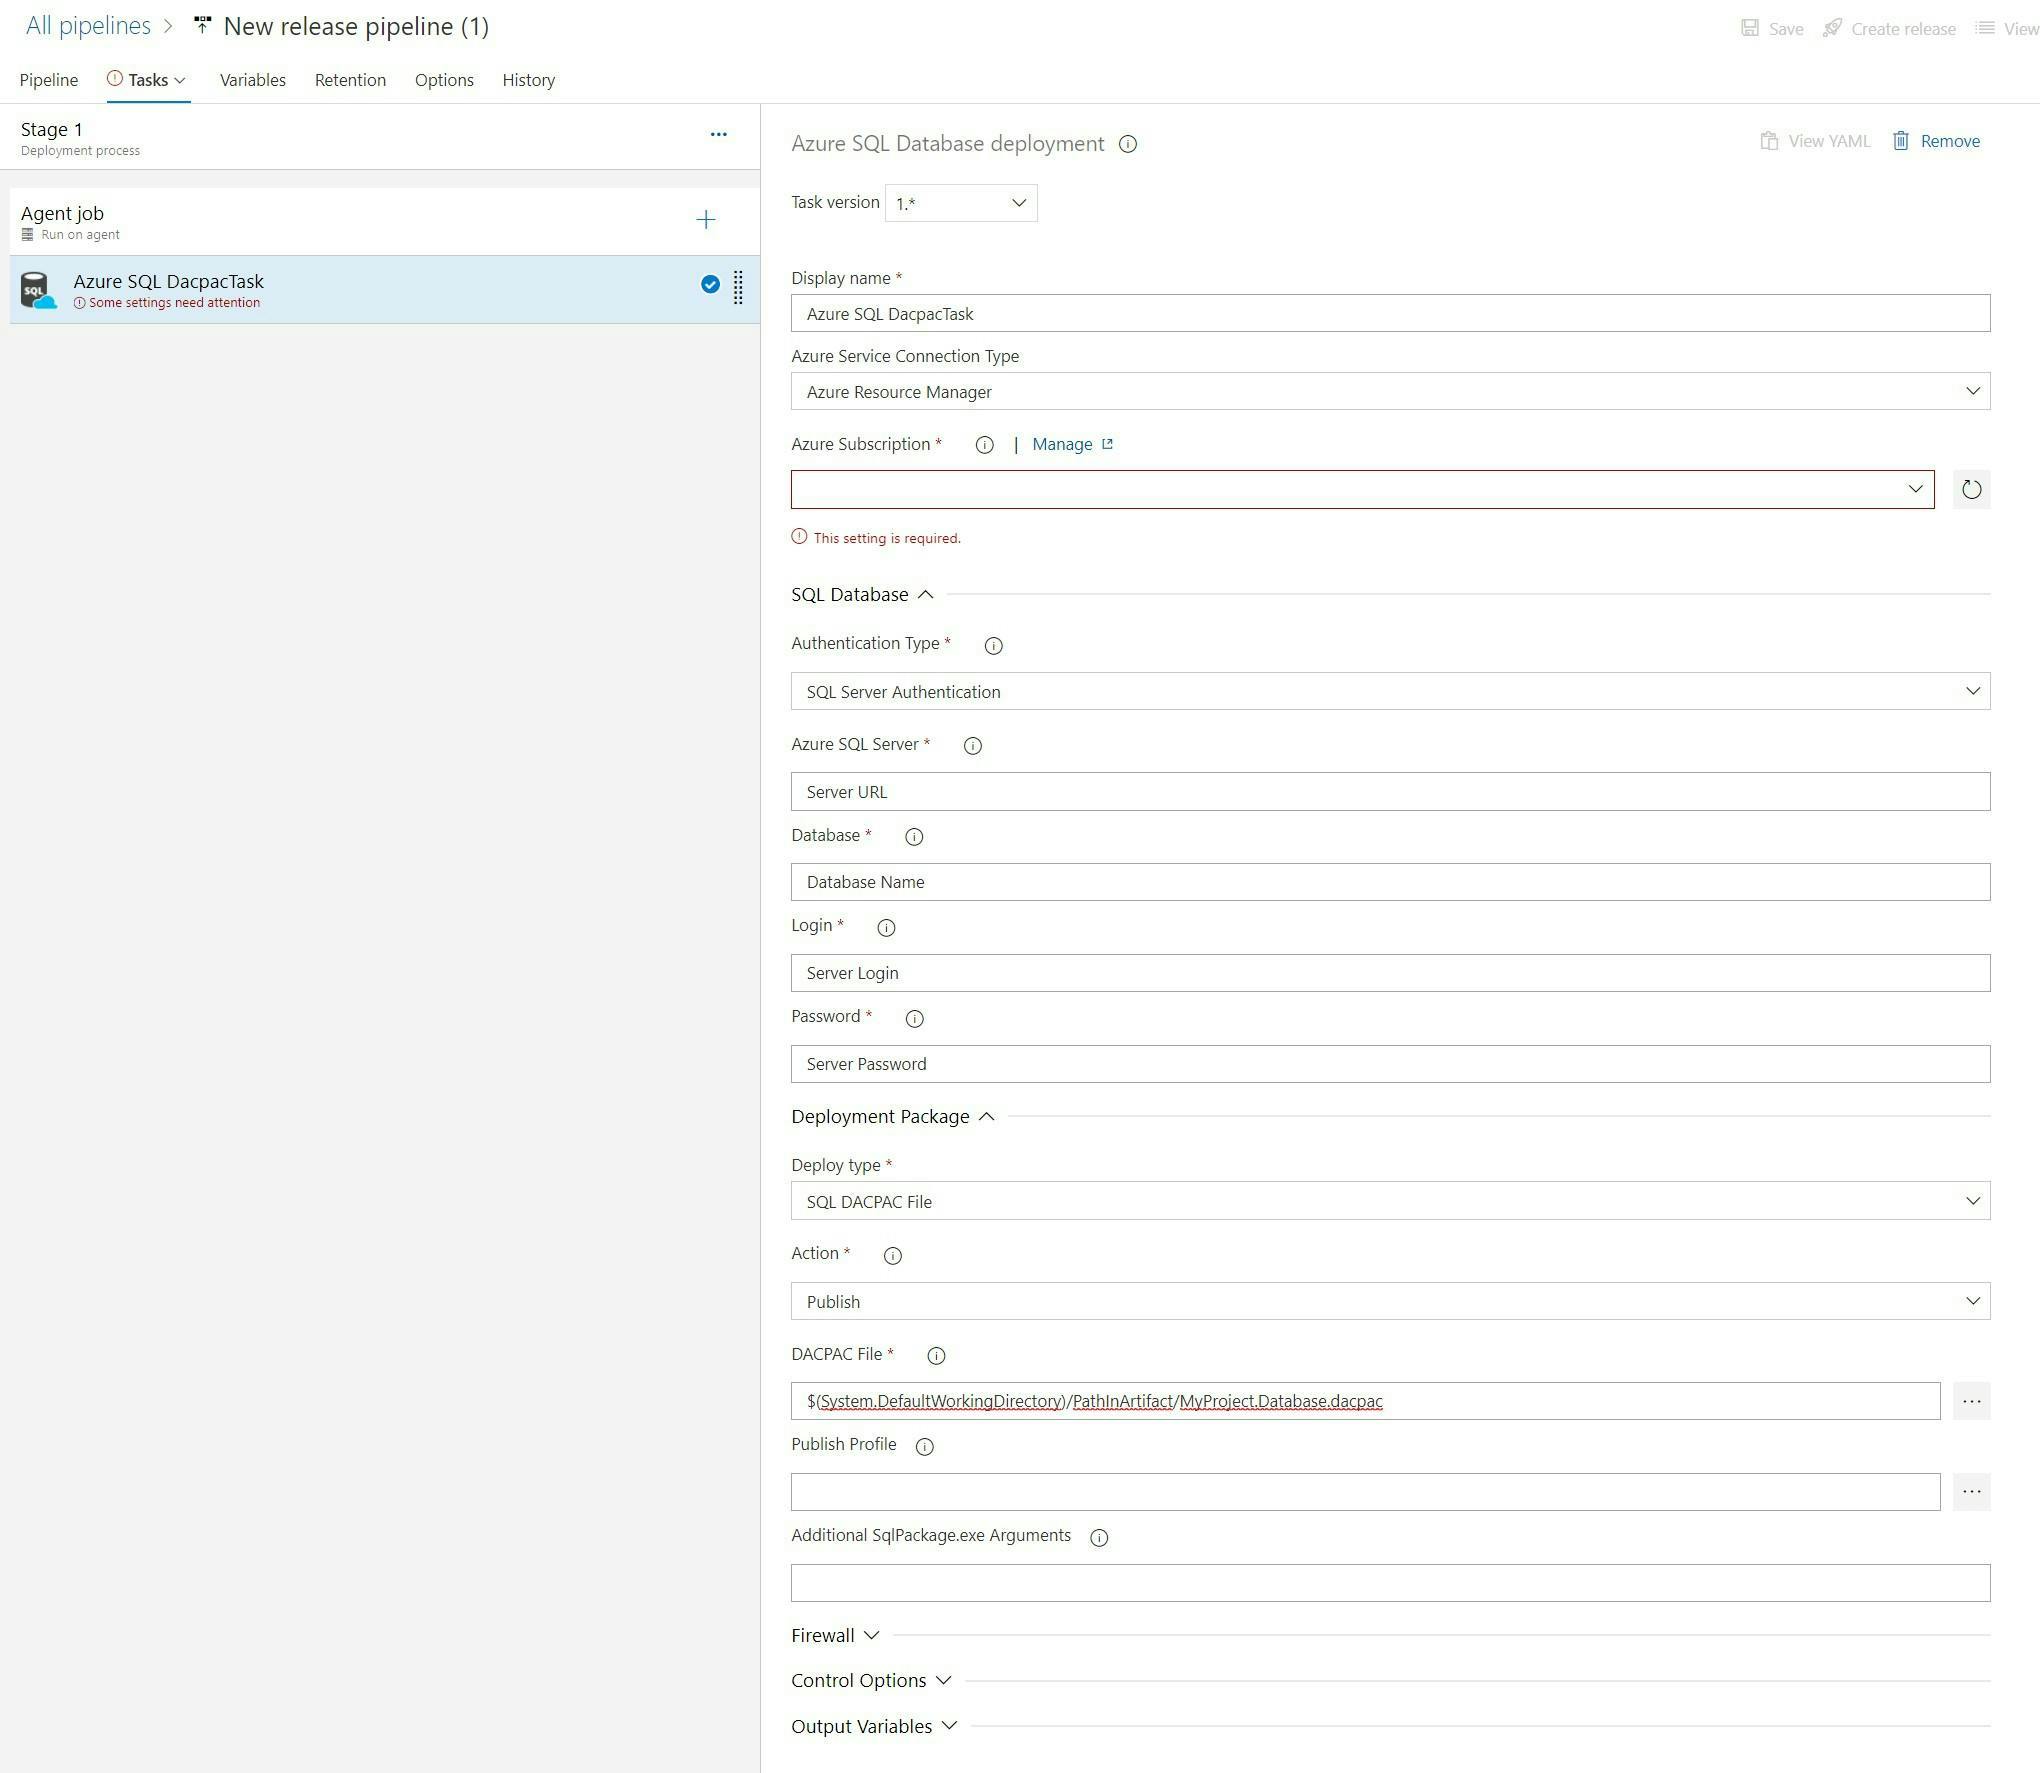
On Agent Job click the plus button to add a task to the agent job. Search for dacpac and click the Add button on Azure SQL Database deployment.

Complete the fields to configure which DB it will be deployed to (as shown in the picture but with your details).

And that's it. You can now run the pipelines and your SQL Project will be deployed to SQL Azure.

Some other tips

On the Azure SQL Database deployment task there is a property called Additional SqlPackage.exe Arguments this can be used to specify things like should loss of data be allows. You can find the list of these at this url https://docs.microsoft.com/en-us/sql/tools/sqlpackage/sqlpackage?view=sql-server-ver15#properties

If you are deploying to multiple environments you will want to use variables for the server details rather than having them on the actual task. This will make it easier to clone the stages and have all connections details configured in one place.

Azure Data Factory: Date formats when working with XML in Data Flows

Azure Data Factory: Date formats when working with XML in Data Flows

If there was one thing you could guarantee would always go wrong when importing data it's date formats. Some countries like to show dates as dd/MM/yyyy others prefer MM/dd/yyyy and despite formats like yyyy-MM-dd being a thing in programming for a very long time, people seem to still create files with these ambiguous formats.

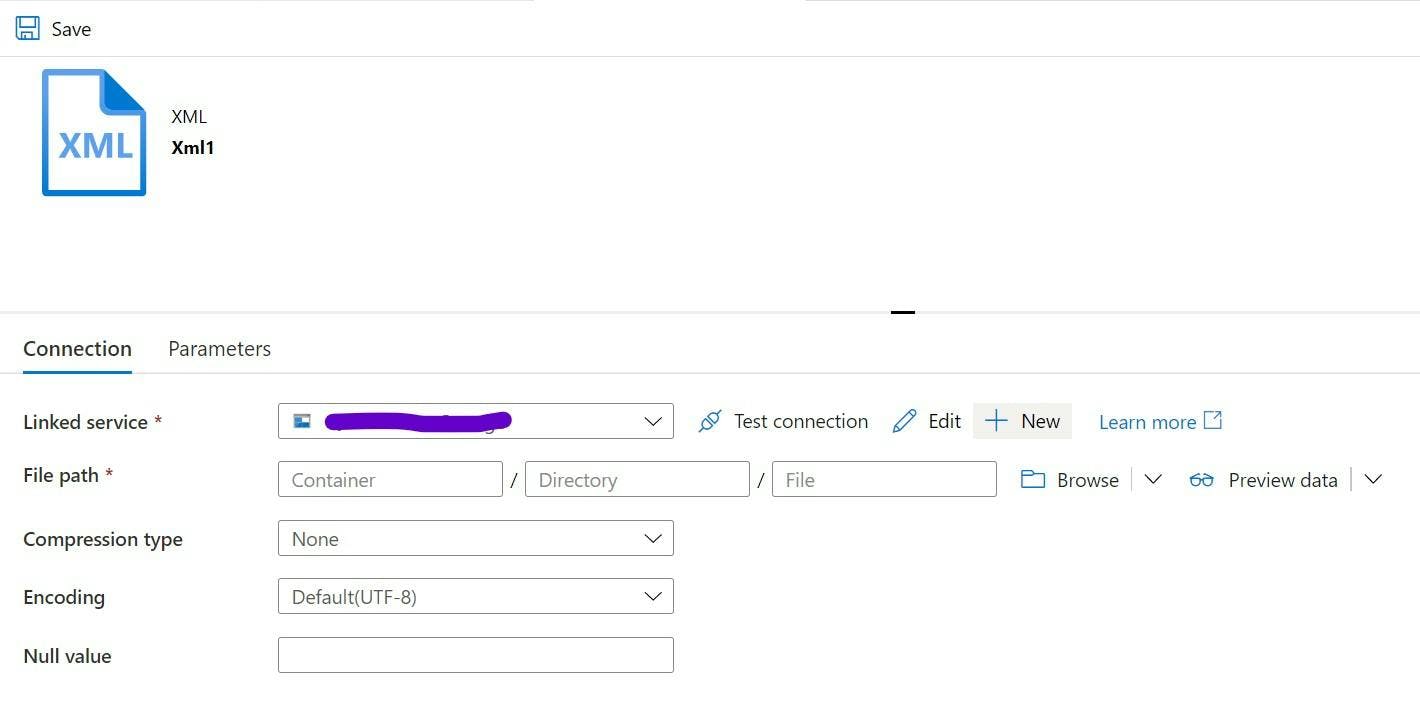
I found finding out how to specify what format the date is in within a flat file was not obvious. If you go to the dataset item for a XML file, unlike other formats it's missing the schema tab.

This wasn't overly surprising as I've come to find when using Datasets in a Mapping Data Flow half the time it seems to ignore any schema definition, or if you use wildcard paths it even seems to ignore all the path settings on the dataset.

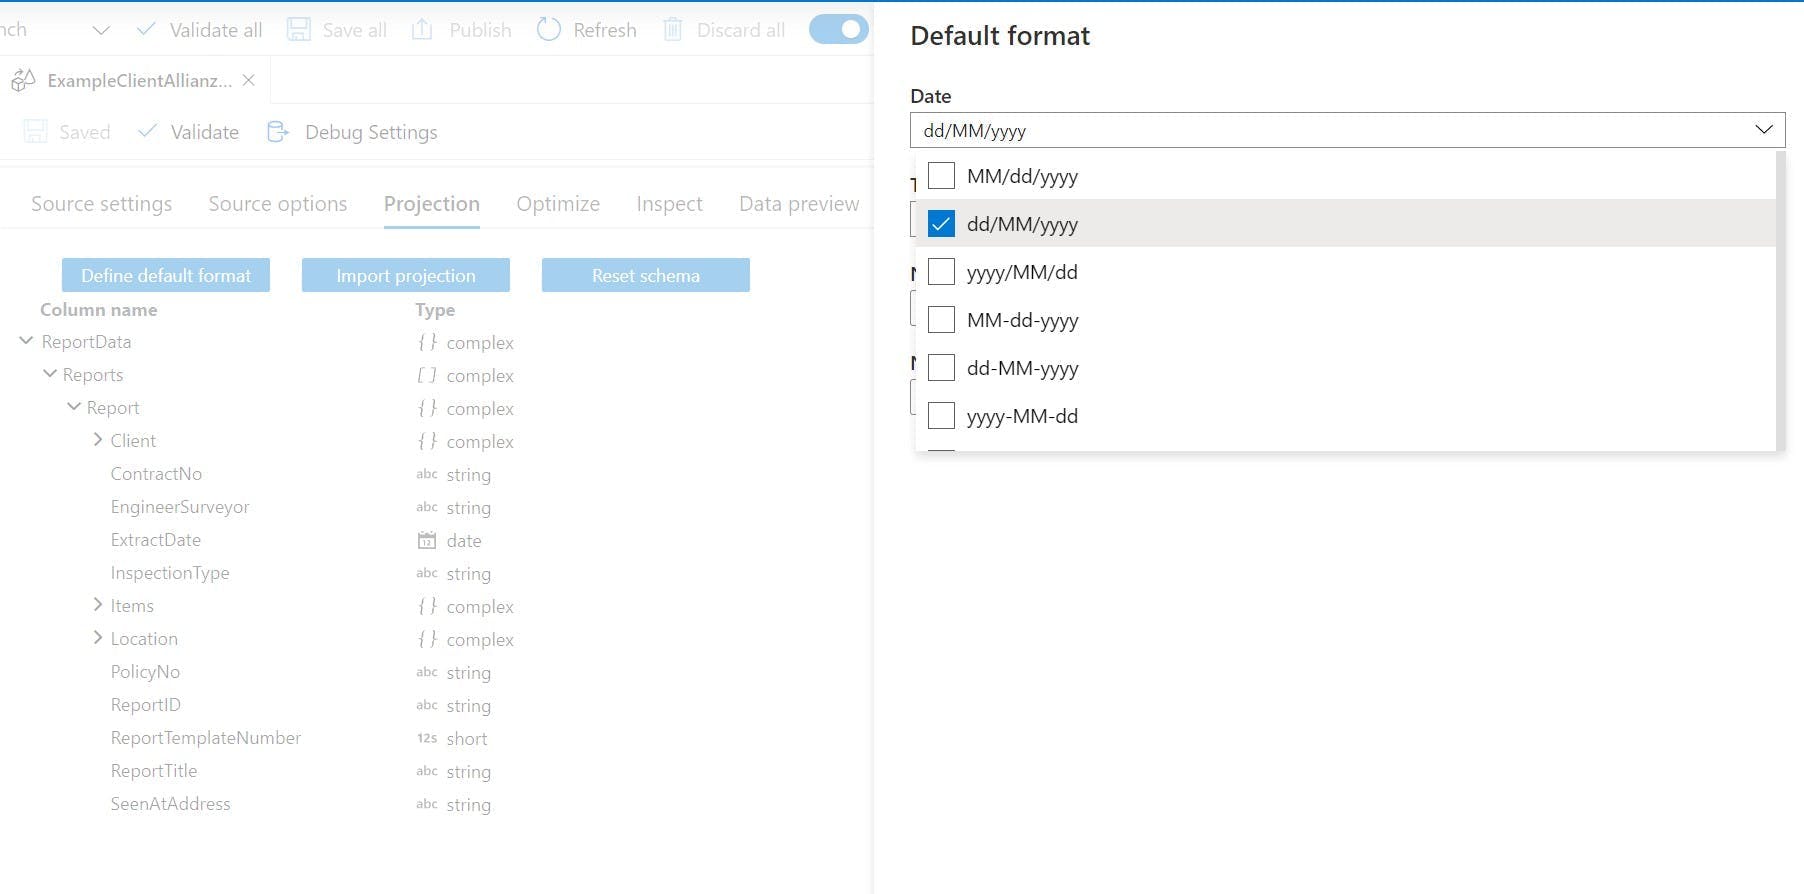
Within the Data Flow, the source has a projection tab which will import a schema from your xml file. If your data looks like a date, then this will hopefully set the data type to date. One thing I found was having data in dd/MM/yyyy resulted in a format of string rather than date. Annoyingly unless you want to start manually editing the script the UI generates, there's no way of fixing the projection.

Assuming you have a date as the data type this is a good start, but I then found when I ran my data flow which had dates in dd/MM/yyyy, the date field was blank! So it definitely knows it's a date and not a string, but it's doesn't like the format so it's ignored the data.

Back on the projection tab of the source there is another button "Define default format". This will open a side panel where you can set what format your dates, times, whole numbers and fractions will be in. Once I had set this, my dates started feeding through.

Debugging VueJS + TypeScript with VS Code

Debugging VueJS + TypeScript with VS Code

I recently asked a developer working with VueJS how they do debugging and they told me console.log. Not wanting to go back to the dark ages of development I went and found the solution myself.

The VueJS website has a guide on how to do debugging with VS Code https://vuejs.org/v2/cookbook/debugging-in-vscode.html however the instructions they give don't work with TypeScript. Interestingly it does get you far enough to set breakpoints within either Chrome or Edge, but I don't really count that as a solution. The idea of debugging is you step through your code and see everything that is happening, not step through a copy of your code and then go and find the corresponding file in your code editor.

After a bit of digging I managed to get it to work, so here's my solution.

Prerequisites

This part is essentially as per the VueJS guide.

Make sure you have VS Code installed and install the Debugger for Chrome. Don't worry if you use Edge, the same extension will work.

Create your project with the vue-cli, following the instructions in the Vue CLI Guide. When you do this make sure you pick Typescript.

Displaying Source Code in the Browser

This isn't what we're after but it's still a step we must do.

Create a file called vue.config.js in the root of your solution and paste the following into it. This creates the mapping for the debugger to map compressed files back to the original.

1module.exports = {
2 configureWebpack: {
3 devtool: 'source-map'
4 }
5}

Configure debugging from VS Code

In VS Code select the Run and Debug button on the left and click the Run and Debug button. If you don't see this button it probably means that you already have a launch.json file defined. Instead a cog will appear at the top to edit the existing settings.

VS Code Run and Debug

From the options choose either Chrome or Edge.

VS Code select Chrome

This will create a launch.json file with some defaults filled out. Replace the contents of the file with the below (this is the part which differs from the instructions on VueJS's site).

I have included 2 configurations, one for debugging with Chrome and the other for Edge. They are both essentially the same and just launch a different browser.

1{
2 // Use IntelliSense to learn about possible attributes.
3 // Hover to view descriptions of existing attributes.
4 // For more information, visit: https://go.microsoft.com/fwlink/?linkid=830387
5 "version": "0.2.0",
6 "configurations": [
7 {
8 "type": "pwa-msedge",
9 "request": "launch",
10 "name": "vuejs: edge",
11 "url": "http://localhost:8080",
12 "webRoot": "${workspaceFolder}",
13 "breakOnLoad": true,
14 "sourceMapPathOverrides": {
15 "webpack:///./*": "${webRoot}/*"
16 },
17 "skipFiles": [
18 "${workspaceFolder}/node_modules/**/*"
19 ]
20 },
21 {
22 "type": "chrome",
23 "request": "launch",
24 "name": "vuejs: chrome",
25 "url": "http://localhost:8080",
26 "webRoot": "${workspaceFolder}",
27 "breakOnLoad": true,
28 "sourceMapPathOverrides": {
29 "webpack:///./*": "${webRoot}/*"
30 },
31 "skipFiles": [
32 "${workspaceFolder}/node_modules/**/*"
33 ]
34 }
35 ]
36}

Debug from VS Code

To start your debugging you still need to start the application from a terminal with npm run serve. The debugging experience is more like Visual Studios attaching to a process rather than running application by clicking start.

Once your application is running, to attach the debugger either press either F5 or go to the run and debug tab, make sure your browser of choice is selected and click the green play button. Your browser of choice will now open and VS Code should be attached and any break points you create will be hit.